30-Day Borrow Rates 📊on RociFi at Launch 🚀
Jun 27
It all comes down to interest rates. As an investor, all you’re doing is putting up a lump-sum payment for a future cash flow — Ray Dalio
Competitive interest rates within the bounds of prudent risk management are at the heart of RociFi’s risk management strategy. Using information collected from market conditions, rates will be updated regularly. There are three distinct parts which comprise the borrow rates charged per risk pool.
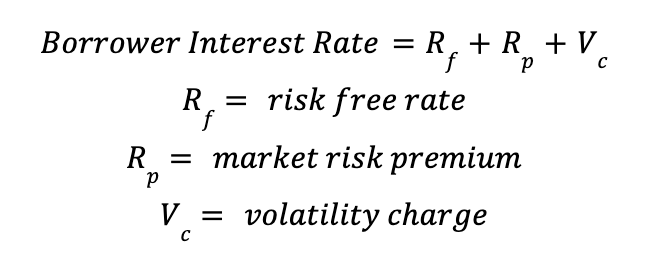
Borrow rates across lending pools will differ based upon expected borrower default risk within that respective pool. This approach allows lenders to deposit into pools which match their risk and return preference.
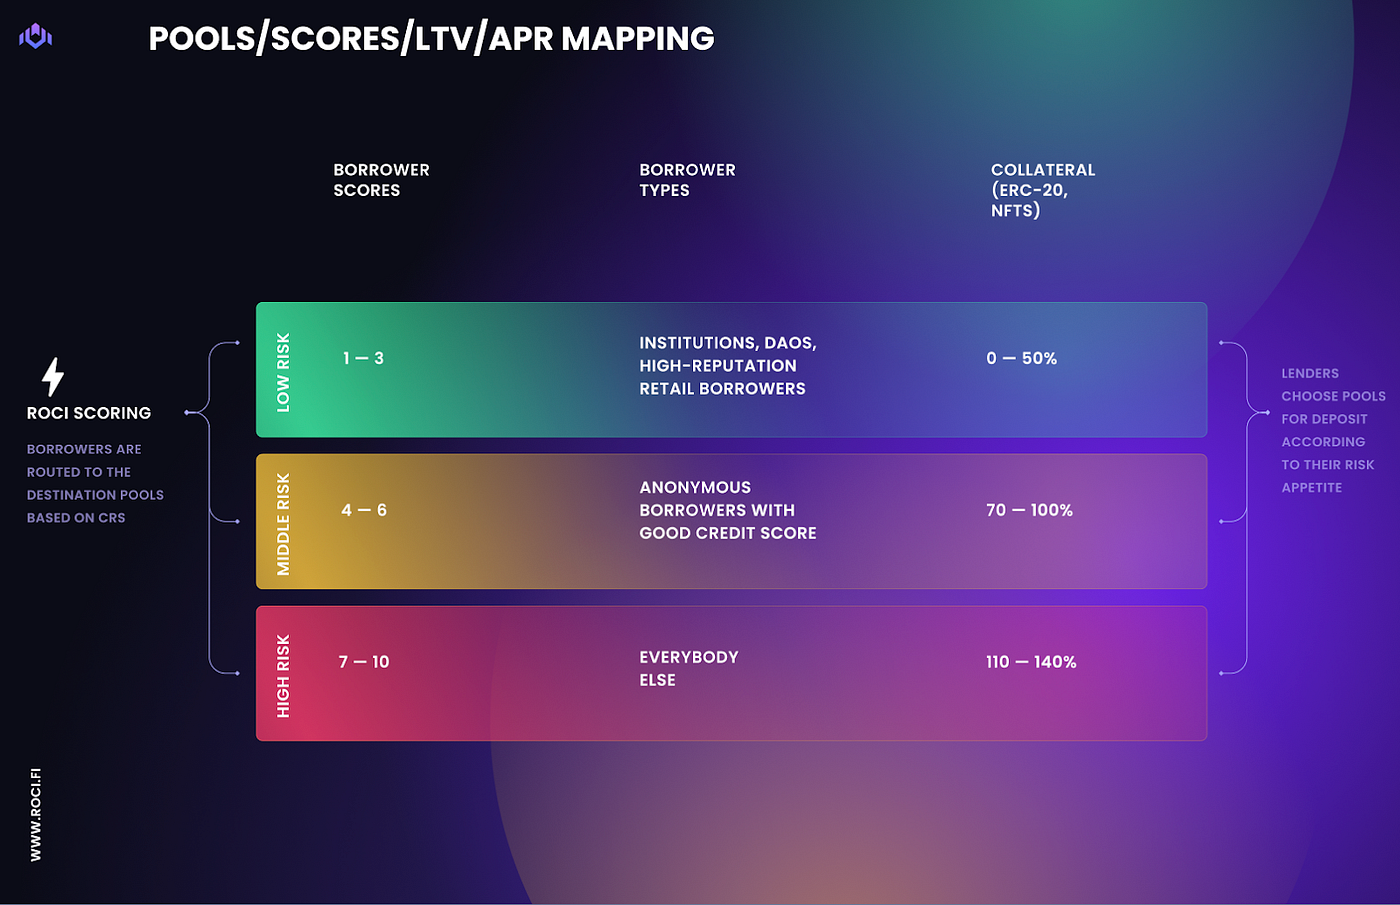
For reference, RociFi’s credit risk scale is 1 to 10 with 1 rated borrowers having the lowest expected default risk and 10 rated borrowers having the inverse.
At launch, credit scores of 1–3 represent the lowest level of risk, i.e. low risk pool. Typically speaking, these will be large institutions, certain DAOs, and High-Reputation retail borrowers.
Scores 4–6 represent the mid risk pool. These are anonymous borrowers with solid DeFi history and some form of on-chain reputation. These borrowers likely have a good borrowing history among other protocols, and have extensive interactions with the broader ecosystem.
Scores 7–10 represent the high risk pool. These are borrowers who have either poor borrowing history across DeFi, or no history at all. These borrowers will not be given under-collateralized loans at launch, but rather over-collateralized loans at above-market LTVs as a way to build their credit and reputation within the RociFi ecosystem.
At launch, all loans issued will be 30-day fixed rate and the effective 30-day borrow rate for each lending pool will be
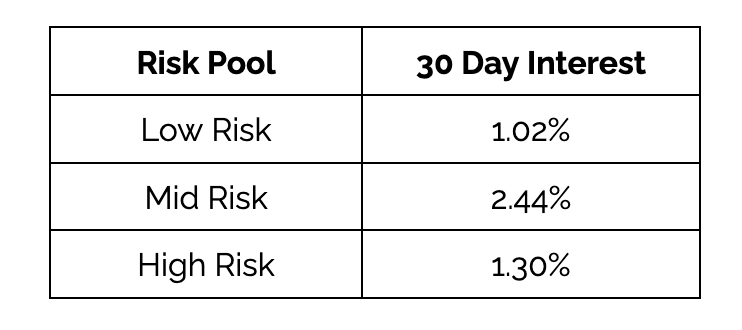
Please note: this is a 30-day interest charge, not APY.
For example, a mid-risk borrower taking out a 500 USDC loan at T0 will need to repay 512.20 USDC at T30 → 500 USDC * (1+2.44%)
One could extrapolate RociFi’s 30-day rates to an effective APY, assuming a lender maintains their lending pool deposit for a one-year period
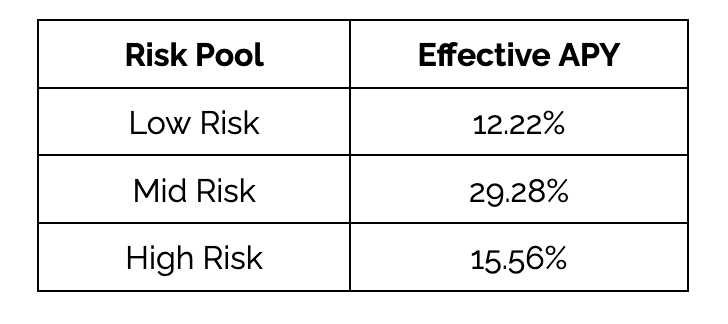
Please note: the above APYs are not guaranteed nor expected lender returns given rates are likely to change with market conditions.
Risk Free Rate
This is defined as the rate of return at which an investor could accrue to their capital “free of risk”. In TradFi, the most common benchmark is the yield on the 3-month U.S. Treasury. In a decentralized world, the definition of what is relatively “risk free” may need to differ. For the time being, RociFi has selected AAVE’s USDC deposit APY as the risk-free rate of return a lender could expect to earn in a DeFi context.
This was selected for two reasons. First, USDC is the largest and most generally trusted stablecoin in the ecosystem. Second, AAVE is both large and risk-averse with over-collateralized loans showing minimal losses to USDC depositors historically.
At the time of writing, Aave’s stable yield rate for USDC is 10.46%.
Risk Premium
Ideally, the total interest RociFi charges to a borrower would be in-line with the equilibrium interest rate that lenders and borrowers agree upon given market conditions and perceived risks of both parties.
In practice, that interest rate will likely be off from the true equilibrium rate. To address this, we are developing a “Market Risk Premium” that will attempt to bring the total borrowing rate in-line with the optimal rate that the market would agree to in absence of any interference rate from RociFi.
To do this, similar to AAVE, RociFi will implement a utilization-based approach as follows
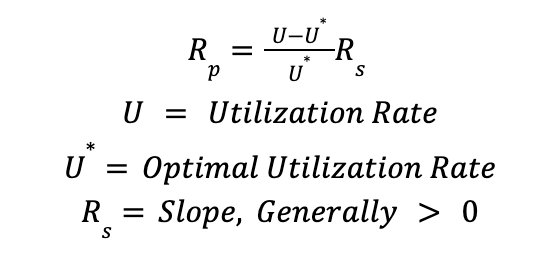
In essence, the formula simply adjusts the Risk-Premium up when utilization goes above the optimal level and adjusts the Risk-Premium down (negative) when utilization goes below the optimal level.
The logic behind this is that if utilization is relatively high, either rates are not high enough compared to other protocols offering a similar level of risk. Thus, to reduce utilization and increase loanable funds, rates must rise to attract additional lenders. Likewise, if utilization is too low, rates are likely too high compared to borrower demand elasticity. Thus, to increase utilization, rates must decline in order to stimulate borrowing demand.
At launch however, RociFi will be implementing the risk premium via a fixed spread estimated from an assumed default risk, i.e chance of default. Using data collected from fixed spreads vs. the actual utilization rates, we will seek to fit an Rs given some assumption about U*.
In general, on the supply side, we expect lenders to be less willing to lend when rates are too low given default risks. As RociFi’s primary concern is to ensure lenders feel comfortable providing liquidity in all markets, analysis will focus on selecting U* that keeps borrow rates in line with default rates.
Below we show the Empirical Cumulative Density Functions (“ECDF”) for each lending pool using our launch assumptions for “L” & “R” over a backtest period that runs from 2020–04–15 to 2022–06–20. This window was chosen as it includes both bull and bear markets. The simulation was produced by picking random starting points for each loan, then simulating a new loan with some predetermined default outcome drawn from a Bernoulli distribution parameterized with a probability of default estimated from known historical liquidation rates, fraud rates, and implied volatility.
At each new loan start, the lender provides a dollar of capital. If the loan does not default, the lender gets his principal back + interest. If the loan defaults, the lender gets the liquidation value of the collateral. Thus over time, the simulated lender ends up with either a profit or loss which adds to their account. The ECDF shows the probability (y-axis) of a particular ending balance (x-axis) at the end of the backtest period.
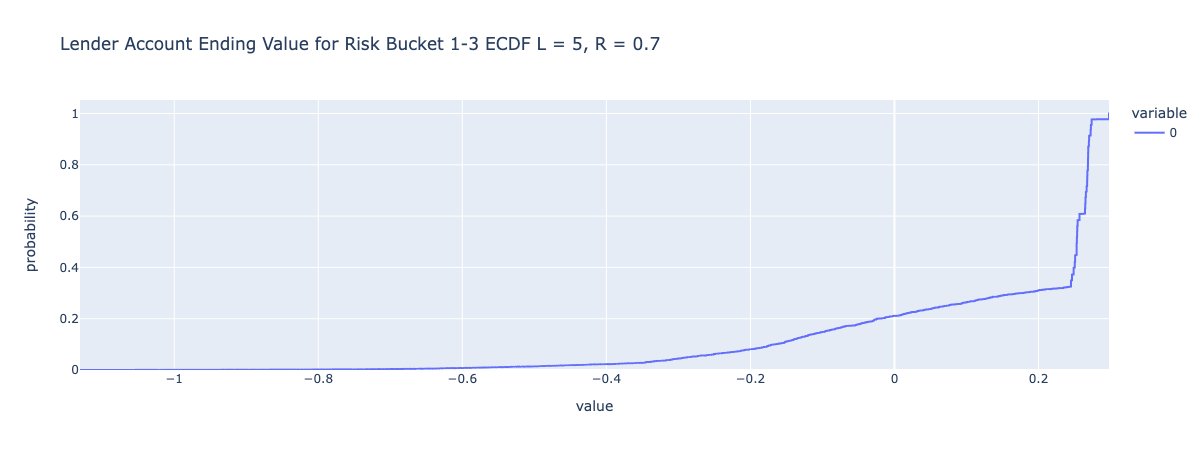
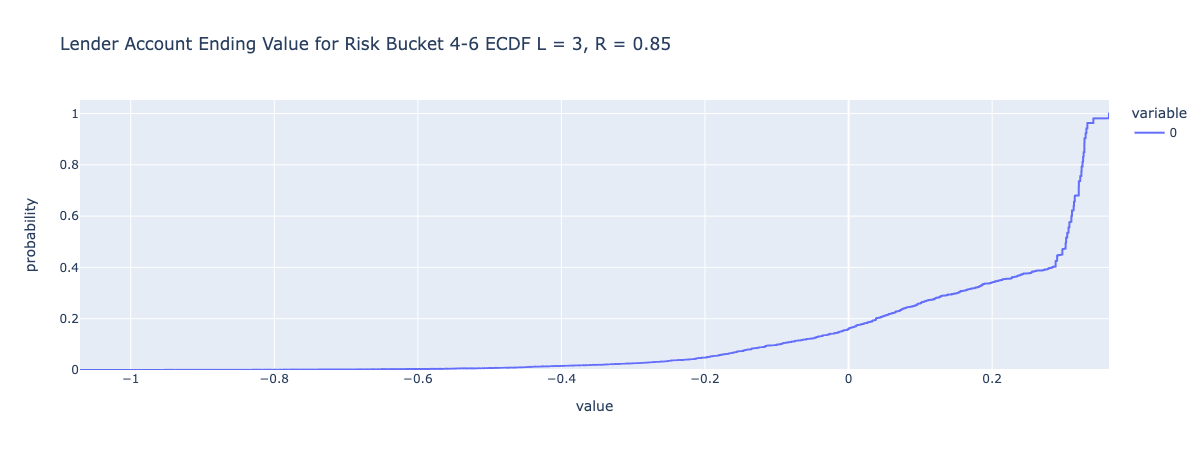
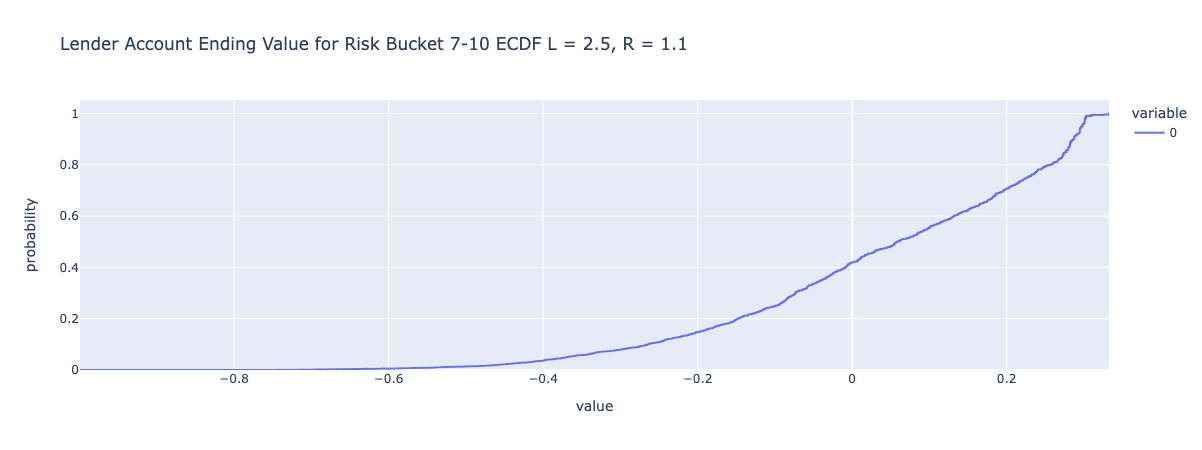
It is the above ECDF simulations that were used to bootstrap the initial chance of default rates within each lending pool. Please note: the expected default rates will change dynamically over time as RociFi collects real-time repayment data.
Volatility Charge
In the event the borrower chooses to default, they will not only lose their posted collateral, but also their NFCS (credit, reputation, and trust credential). Although this may seem like a bad outcome, in some cases it may make economic sense for a borrower to do so.
For example, if a borrower posts 800 USDC of collateral for a 1000 USDC loan, and that collateral value suddenly drops to say 200 USDC, the borrower may prefer to walk away from their loan rather than having to repay 1000 USDC + interest to regain 200 USDC worth of collateral. The Volatility Charge addresses this “Walkaway Risk”. The Volatility Charge derives an expression for the cost to hedge the value of the loan from the contingent default risk caused by collateral prices falling sufficiently low such that the effective LTV of the loan is high enough to entice the borrower to walkaway.
The below linear approximation captures the Volatility Charge

In general, the Volatility Charge will decrease as collateral ratios increase (as there is less chance the LTV threshold is crossed) and increase as implied volatility increases (as there is a higher probability the threshold gets crossed).
Using historical liquidation rates, market prices, and implied volatility, the initial LTV thresholds for each lending pool are
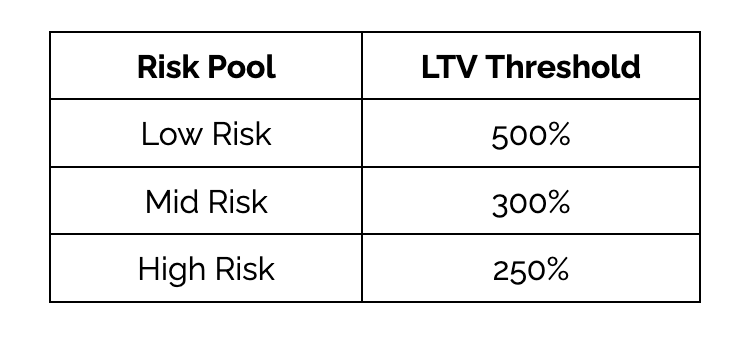
This should intuitively make sense given more creditworthy borrowers are likely more reluctant to forgo their NFCS and walk away from a loan.
Vol Charge is a function of the LTV threshold and current implied volatility for ETH (the only collateral asset supported at launch), which has spiked recently due to market conditions.
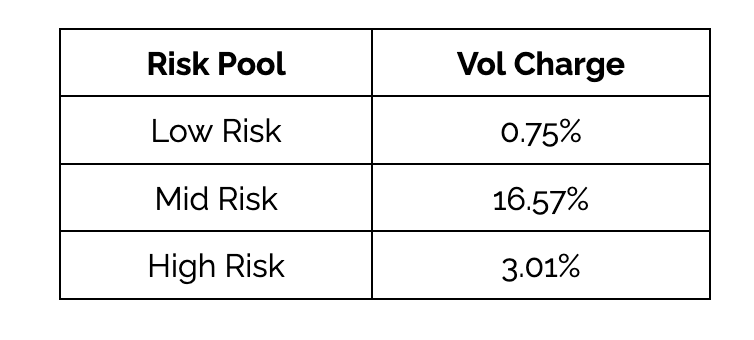
As we collect more data, the Vol Charge assumptions will be revised, thus increasing or decreasing the borrow rates.
The below graphics show the potential returns to depositors in the low and mid risk lending pools (under-collateralized pools) over a variety of repayment and utilization rates. The sensitivity analysis offers a holistic view of potential returns to lenders under good and bad repayment outcomes.
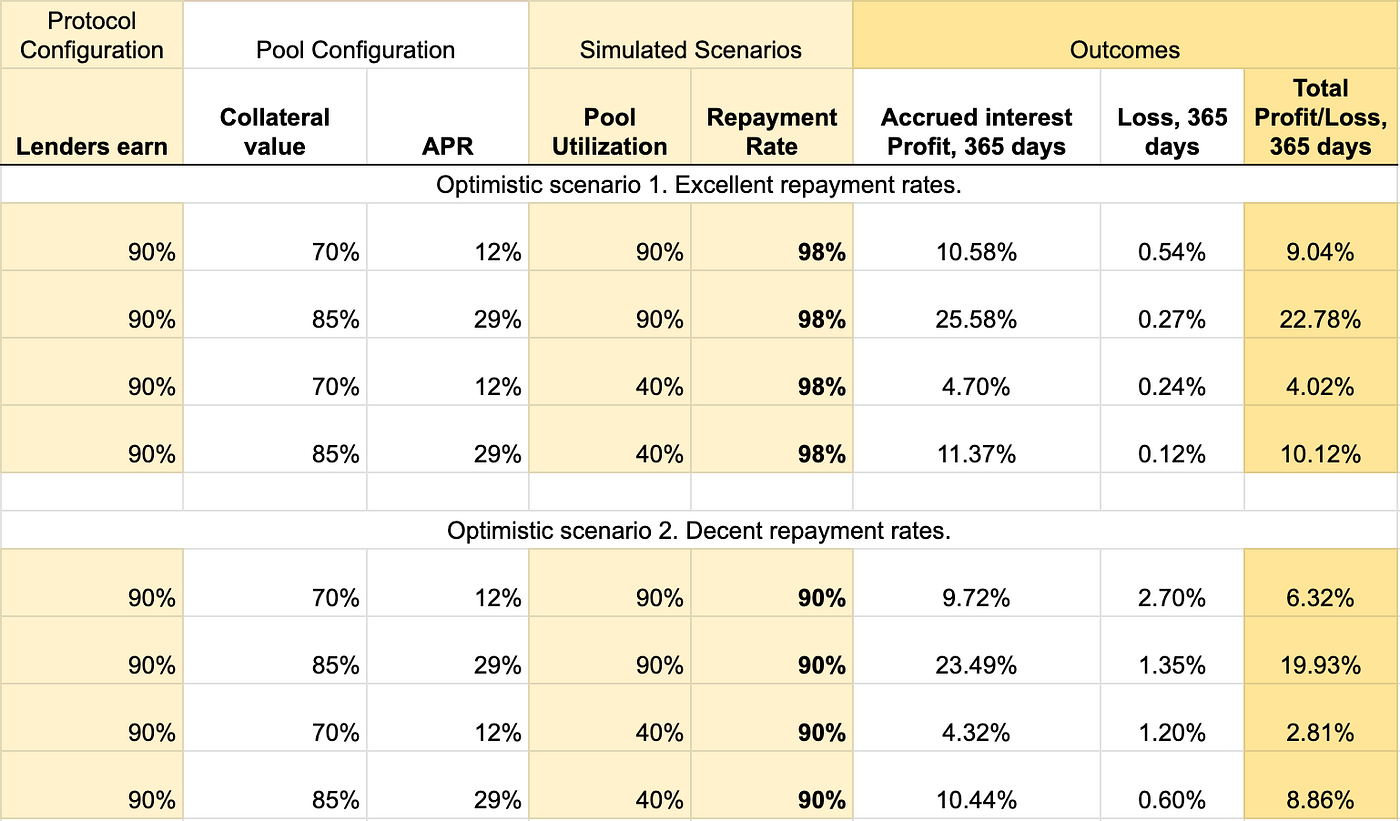
The optimistic scenarios include repayment rates of 98% and 90%, thus assuming 2% and 10% default rates, respectively. For reference, the current non-performing loan (NPL) ratio in the US is 1.24%. Thus, the ‘excellent repayment’ scenario assumes a 61% higher default rate than the national average and the ‘decent repayment’ scenario assumes a 706% higher default rate than the national average.
RociFi’s actual default rates are unknown, but running sensitivity analysis that assumes a higher than average default rate, even for the optimistic scenarios, is prudent given the riskiness of creating an entirely new loan market.
Under the optimistic scenarios, if a lender maintained their deposit for one-year and rates held constant, both low and mid risk lenders would generate a healthy APY under low and high utilization scenarios.
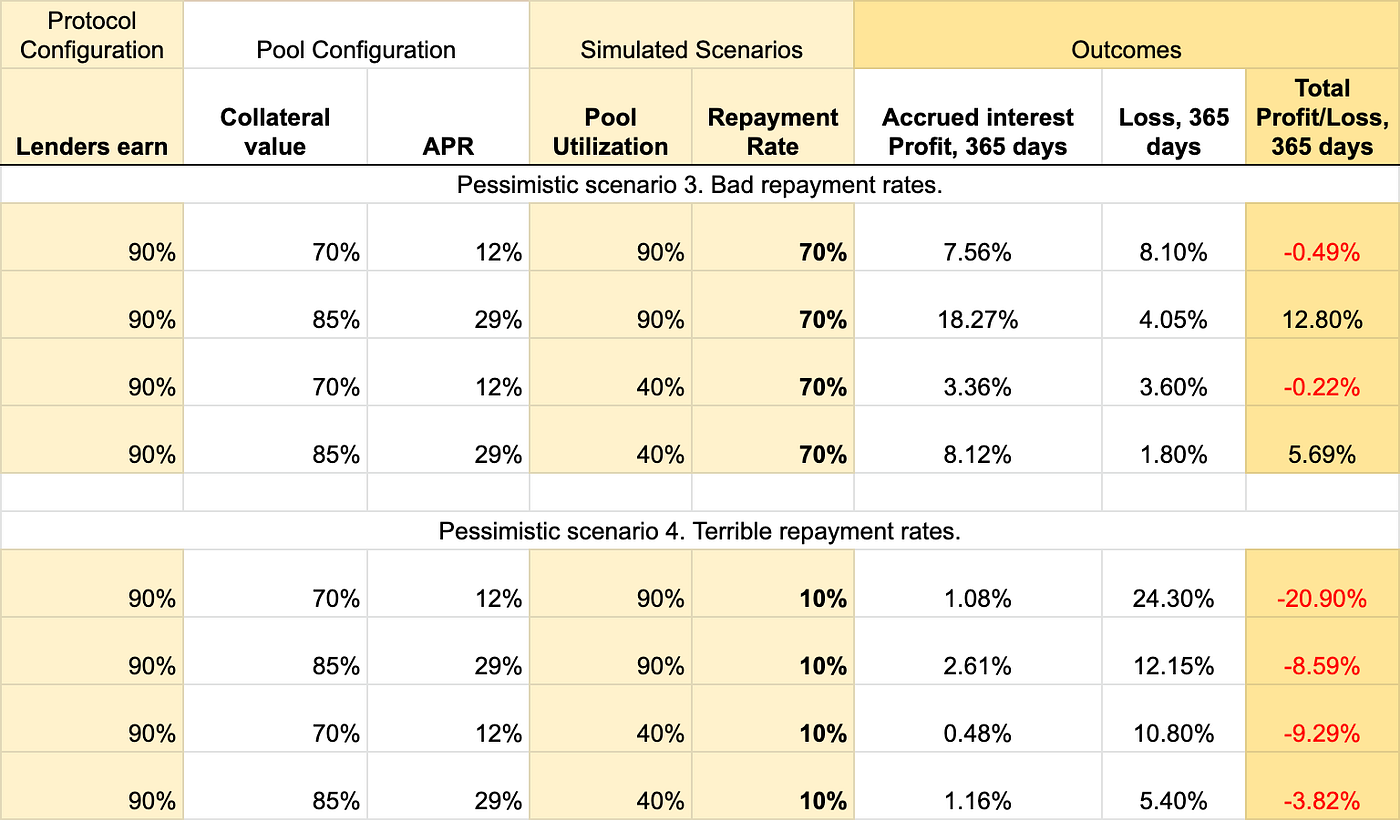
The pessimistic scenarios are meant to convey worst case outcomes to potential lenders given they will bear any losses at launch. The simulated repayment rates of 70% and 10%, i.e. default rates of 30% and 90% are astronomical by conventional lending standards. Respectively, ‘bad repayment’and ‘terrible repayment’ scenarios are 2319% and 7158% higher than the national average.
Despite the repayment rates, if a lender maintained their deposit for one-year and rates held constant, low risk depositors will suffer a very small loss on ‘bad repayment’ and mid risk depositors will still generate a good APY under both low and high utilization scenarios.
However, depositors in both pools would have experienced higher than average losses in the event of the ‘terrible repayment’ scenario.
Please note: The aforementioned sensitivity analysis is not meant to forecast returns nor default rates, but rather highlight the margin of safety built into RociFi lending pools by our rate strategy under a broad range of repayment outcomes. However, given RociFi is creating an entirely new loan market, default rates might be elevated at the beginning until our credit scoring adjusts using the new data. Given that, it’s important to share potential bad outcomes with depositors as to fully appreciate the risks given they will bear any losses at launch.
RociFi’s rate strategy is designed to be easily understandable, effective at managing risk, and ensure that borrow rates meet both lender and borrower elasticities. Over time, as RociFi collects more data, we will be able to improve the calibration of rates to dynamically adjust to market conditions for loanable funds.
______
RociFi is a risk-based DeFi Credit Protocol